IRQ test tool
Introduction
This tool is to test interrupt handling in TF-M. Testing different interrupt scenarios is important as the ARMv8-M architecture does complex operations when interrupt happens, especially when security boundary crossing happens. These operations need to be considered by the TF-M implementation, as in a typical use case there is a separate scheduler on the Non-Secure and the secure side as well, and the SPM needs to maintain a consistent state, which might not be trivial.
The aim of the tool is to be able to test scenarios, that are identified to be problematic, in a reproducible way, and do this in an automated way, so regular regression testing can have a low cost.
How the tool works
The tool is a set of Python scripts which need to be run inside a debugger. Currently Arm Development Studio and GDB are supported. During the test run, the script interacts with the debugger, sets breakpoints, triggers interrupts by writing into system registers, starts the target, and when the target is stopped, it examines the target’s state.
A typical execution scenario looks like this:
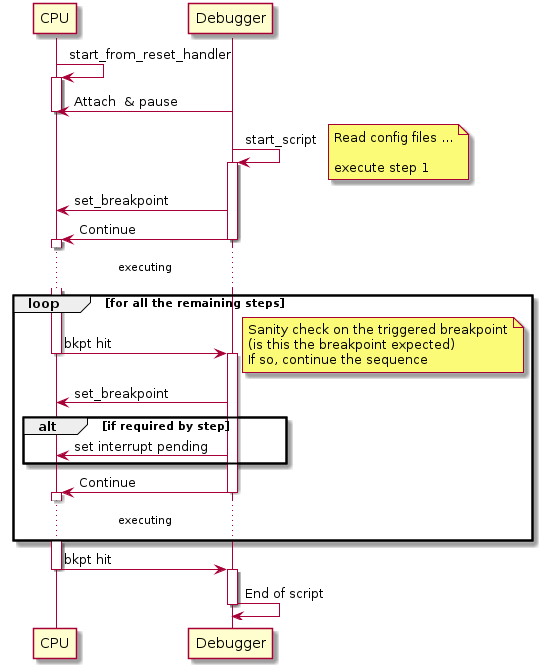
Once started inside the debugger, the script automatically deduces the debugger it is running in, by trying to import the support libraries for a specific debugger. The order the debuggers are tried in the following order:
Arm Development studio
GDB
If both check fails, the script falls back to ‘dummy’ mode which means that the calls to the debugger log the call, and returns successfully.
Note
This ‘dummy’ mode can be used out of a debugger environment as well.
Important
The script assumes that the symbols for the software being debugged/tested are loaded in the debugger.
The available parameters are:
short option |
long option |
meaning |
|---|---|---|
|
|
Use sw breakpoint (the default is HW breakpoint) |
|
|
The name of the IRQs json |
|
|
The name of the file containing the testcase |
|
|
The name of the breakpoints json file |
Input files
Breakpoints
below is a sample file for breakpoints:
{
    "breakpoints": {
        "irq_test_iteration_before_service_calls": {
            "file": "core_ns_positive_testsuite.c",
            "line": 692
        },
        "irq_test_service1_high_handler": {
            "symbol": "SPM_CORE_IRQ_TEST_1_SIGNAL_HIGH_isr"
        },
        "irq_test_service2_prepare_veneer": {
            "offset": "4",
            "symbol": "tfm_spm_irq_test_2_prepare_test_scenario_veneer"
        }
    }
}
Each point where a breakpoint is to be set by the tool should be enumerated in this file, in the “breakpoints” object. For each breakpoint an object needs to be created. The name of the object can be used in the testcase description. The possible fields for a breakpoint object can be seen in the example above.
tools/generate_breakpoints.py
This script helps to automate the generation of the breakpoints from source files. Each code location that is to be used in a testcase, should be annotated with one of the following macro in the source files:
/* Put breakpoint on the address of the symbol */
#define IRQ_TEST_TOOL_SYMBOL(name, symbol)

/* Put a breakpoint on the address symbol + offset */
#define IRQ_TEST_TOOL_SYMBOL_OFFSET(name, symbol, offset)

/* Put a breakpoint at the specific location in the code where the macro is
 * called. This creates a file + line type breakpoint
 */
#define IRQ_TEST_TOOL_CODE_LOCATION(name)
Usage of the script:
$ python3 generate_breakpoints.py --help
usage: generate_breakpoints.py [-h] tfm_source outfile

positional arguments:
tfm_source  path to the TF-M source code
outfile     The output json file with the breakpoints

optional arguments:
-h, --help  show this help message and exit
IRQs
{
    "irqs": {
        "test_service1_low": {
            "line_num" : 51
        },
        "ns_irq_low": {
            "line_num" : 40
        }
    }
}
Each IRQ that is to be triggered should have an object created inside the “irqs” object. The name of these objects is the name that could be used in a testcase description. The only valid field of the IRQ objects is “line_num” which refers to the number of the interrupt line.
Testcase
{
    "description" : ["Trigger Non-Secure interrupt during SPM execution in",
                    "privileged mode"],
    "steps": [
        {
            "wait_for" : "irq_test_iteration_start"
        },
        {
            "wait_for" : "spm_partition_start"
        },
        {
            "description" : ["Trigger the interrupt, but expect the operation",
                             "to be finished before the handler is called"],
            "expect" : "spm_partition_start_ret_success",
            "trigger" : "ns_irq_low"
        },
        {
            "wait_for" : "ns_irq_low_handler"
        },
        {
            "wait_for" : "irq_test_service2_prepare"
        }
    ]
}
The test is executed by the script on a step by step basis. When the script is started, it processes the first step, then starts the target. After a breakpoint is hit, it processes the next target, and continues. This iteration is repeated until all the steps are processed
For each step, the following activities are executed:
All the breakpoints are cleared in the debugger
If there is a ‘wait_for’ field, a breakpoint is set for the location specified.
If there is a ‘trigger’ field, an IRQ is pended by writing to NVIC registers.
If there is an ‘expect’ field, a breakpoint is set for the location specified. Then the testcase file is scanned starting with the next step, and a breakpoint is set at the first location specified with a ‘wait_for’ field. Next time, when the execution is stopped, the breakpoint that was hit is compared to the expected breakpoint.
Each object can have a description field to add comments.
How to run the example
Before running the example, the breakpoints.json needs to be generated from the TF-M source tree:
$ cd tools/irq_test/
$ python3 tools/generate_breakpoints.py ../.. example/breakpoints.json
The example also require the regression test suite being present in the TF-M
binary, so either ConfigRegressionIPC.cmake or ConfigRegression.cmake
have to be used to compile TF-M. Also -DCMAKE_BUILD_TYPE=Debug config option
have to be used in the cmake generation command, to be sure that the debug
information is generated in the axf files.
The sequence of running the testcase in the example folder looks like the
following:
Check out a version of TF-M that contains the
IRQ_TEST_TOOL_*macros for the testcaseGenerate breakpoints.json using the TF-M working copy above
Build TF-M checked out above
Start the debugger, connect to the target, and stop the target. (Make sure that the target is stopped before the IRQ testcase of the positive core test suite in TF-M starts executing, as the IRQ test tool’s testcase uses the entry of that TF-M test as a trigger to start.)
Execute the script. The script automatically sets the breakpoint for the first step of the testcase, and continues the target execution.
Examine the output of the script. Successful execution is signalled by the following output line:
===== INFO: All the steps in the test file are executed successfully with the expected result.
Arm Development Studio
The script can be called directly from the debugger’s command window:
Note
In the command absolute path have to be used both for the irq_test.py
and for the parameters.
source irq_test.py -q example/irqs_AN521.json -b example/breakpoints.json -t example/testcase.json
GDB
The script should be sourced inside GDB, without passing any arguments to it.
(gdb) source irq_test.py
That registers a custom command test_irq. test_irq should be called
with three parameters: breakpoints, irqs, and the test file. This command will
actually execute the tests.
Note
This indirection in case of GDB is necessary because it is not possible to pass parameters to the script when it is sourced.
Important
The script needs to be run from the <TF-M root>/tools/irq_test directory as the ‘current working dir’ is added as module search path.
A typical execution of the script in GDB would look like the following:
(gdb) target remote localhost: 2331
(gdb) add-symbol-file /path/to/binaries/tfm_s.axf 0x10000000
(gdb) add-symbol-file /path/to/binaries/tfm_ns.axf 0x00040000
(gdb) source /path/to/script/irq_test.py
(gdb) test_irq -q example/irqs_LPC55S69.json -b example/breakpoints.json -t example/testcase.json
Note
add-symbol-file command is used above as other commands like file
and symbol-file seem to be dropping the previously loaded symbols. The
addresses the axf files are loaded at are depending on the platform they
are built to. The address needs to be specified is the start of the code
section
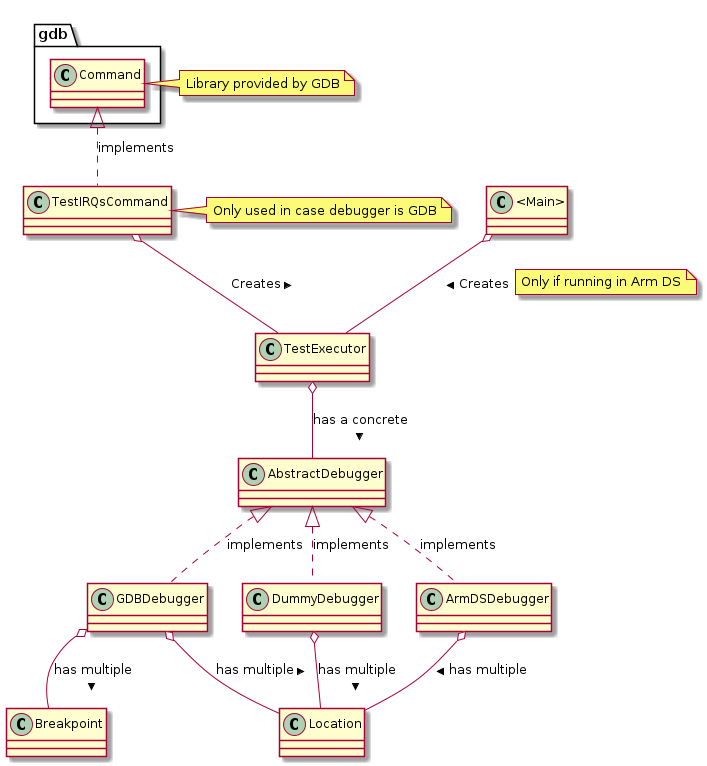
Implementation details
Class hierarchy:
Possible further improvements
Add priority property to the IRQs data file
Add possibility to run randomized scenarios, to realise stress testing.
Copyright (c) 2020, Arm Limited. All rights reserved.